A 2019-2020 Bass Connections in Energy Project
Adapting Deep Learning Techniques to Inform Energy Access Decisions

Aneesh Gupta, Ayooluwa Balogun, Gaurav Uppal, Jason Wang, Norah Tan, Scott Heng On, Winston Yau, Vivek Sahukar

See Our Github Repository

Introduction


Motivation

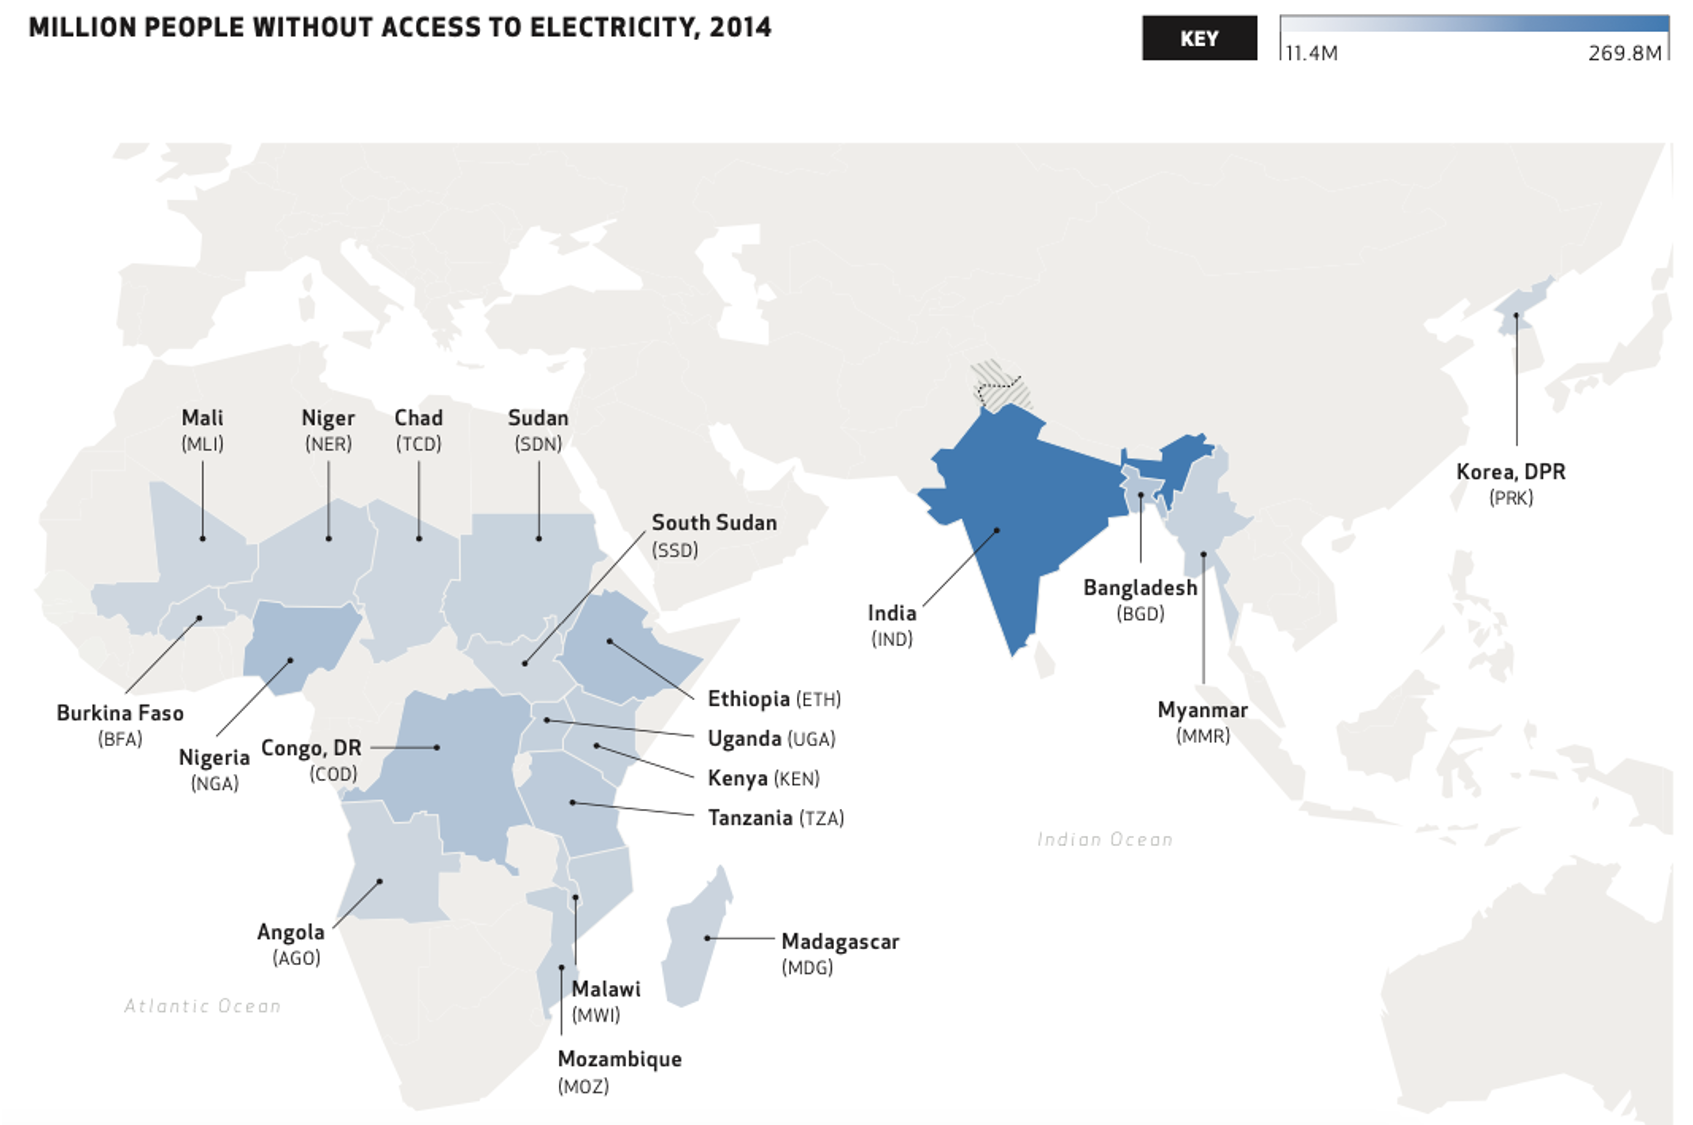
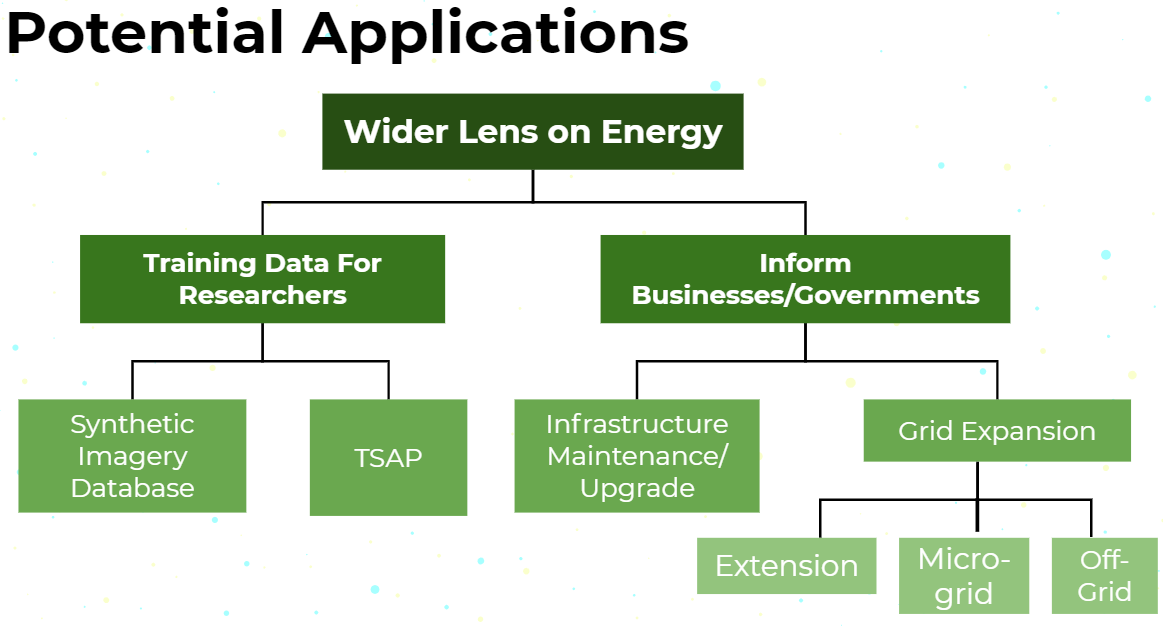
Access to electricity is one of the most important requisites to economic and societal development. It is associated with decreased maternal mortality, increased education levels, and decreased poverty. [P. Alstone, et al. Decentralized energy systems for clean electricity access. ] However, 1 billion people still lack access to electricity. To enable electrification and grid expansion in energy-poor regions, it is crucial to know where the existing infrastructure is. This information can help policymakers and businesses decide on whether to expand the national grid, build a microgrid, or provide direct off-grid solar PV. Current approaches to identifying and mapping energy infrastructure tend to be expensive and time-intensive, consisting of aggregating survey data from the ground level and roughly scaling it across regions. This is where we want to help.

Figure: Electrification around the globe

Our Goal

Our goal as a team is to be able to build a tool that researchers can use to identify and map out worldwide energy infrastructure to supplement ground truth information and allow energy developers and policymakers to make informed decisions on grid expansion.


Final Video Presentation


Check out our final presentation video on what our project is all about!

Project Background


Background

For three years, the Duke Energy Data Analytics Lab has worked on developing deep learning models that identify energy infrastructure, with an end goal of generating maps of power grid networks that can aid policymakers in implementing effective electrification strategies. Researchers have already been able to create an object identification model that can ID different types of energy infrastructure, as shown here: [2018-19 Bass Connections Team]

1. Obtain High-Resolution Satellite Imagery

The high-resolution satellite imagery displays various infrastructure such as building, car, tower clearly and visibly. Using Low resolution images won’t give higher prediction accuracy.

2. Detect Pixels with Objects of Interest

We use the model to detect different objects in the training dataset such as energy infrastructure such as transmission lines and towers in addition to cars, buildings too. The identified objects are bounded by blue boxes.

3. Identify Energy Infrastructure

Finally, the model is tested on new images, where each identified object (bounded by red boxes) was assigned a probability score of belonging to a certain class.


Our Main Research Goal is to Increase Model Adaptability Across Geographies

Image Segmentation is a deep learning model which can segment images and identify target objects at scale by assigning each pixel to a probability. Each Satellite image then can be simplified and partitioned into different segments based on object features, such as color, texture, and gradient, and offer insights on the model's generalizability across different geographic domains. We chose Models for Remote Sensing (MRS) [B. Huang et al. Large-Scale Semantic Classification: Outcome of the First Year of Inria Aerial Image Labeling Benchmark.], an encoder-decoder model to perform the segmentation. Then, we need:

  • Labelled satellite image where each object is identified in the training dataset.
  • After we apply the neural network, we get an output segmented image where the white pixels are the object of interest (such as buildings) that the model has identified and the black pixels are the area which do not have infrastructure.


Deep Learning Model Accuracy Metrics

Figure source: DataScience StackExchange

The output of the model is the predicted bounding boxes around the object of interest - in our case, buildings. In order to apply Intersection over Union to evaluate an (arbitrary) object detector we need:

  • The ground-truth bounding boxes (i.e., the hand labeled bounding boxes from the testing set that specify where in the image our object is).
  • The predicted bounding boxes from our model.

Precision measures how accurate our predictions are. i.e. the percentage of our predictions are correct.
Recall measures how accurately we can find all the positives.
Area of union is the area encompassed by both the predicted bounding box and the ground-truth bounding box.
Area of overlap is the common area between the predicted bounding box and the ground-truth bounding box.

Dividing the area of overlap by the area of union yields our final score — the Intersection over Union.

A detailed blogpost explaining the accuracy metrics with an example can be found here.


Current Model Generalizes Poorly Across Geographies


The task was to identify transmission lines across the four cities shown. In these plots, each colored precision-recall curve corresponds to a single city, and the black curve model has been trained on all cities. The higher the area under the PR curve, the higher the performance of the model. As we can see from the plots, the USA model performed best in each test case, and the models trained on single cities performed equivalently to the USA model only in the same city and performed poorly in other cities.

Source: Mapping electric transmission line infrastructure from aerial imagery with deep learning, Hu, Alexander, Cathcart, Hu, Nair, Zuo, Malof, Collins, Bradbury (2020)


Cross-Domain Accuracy

As shown in the table, the most accurate model for a given city is the model that is trained on that same city, and models trained on a single city don’t necessarily generalize well to the other cities. Furthermore, we found that training a model on all of the cities results in higher test accuracies across the board. To address this problem of transferring learning across geographic domains we want to: Visualize the model’s representation of the current training domain(Goal 2). Provide ways to diversify this training domain (Goal 3).

Numbers in the table represent Intersection over Union. Higher the IoU, better the model performance. Evaluation of models trained on each individual city from the Inria dataset, as well as a model trained on the entire dataset. The models are then evaluated on each city (columns). Orange cells represent the best model for each city, while green cells represent best performance out of all models.

Each Geography is Incredibly Different

Figure: Images are taken for each city from the Google Earth with camera height at 500 m.

As seen in the two object detection tasks, the model accuracy increases if the model is trained on different cities. The geography and building types of each city is enormously different. The reason for improvement in accuracy is that the model is able to learn features of the different cities.

The buildings in Austin and Kitsap are widely spaced, whereas the buildings in Chicago and Vienna are tightly packed. The Kitsap has more green cover and the color of cover is also more green compared to all other cities. The texture of Vienna buildings has a peculiar reddish tone. Due to the difference in the physical features of each city, the training dataset should be representative of all these different features for the model accuracy to improve significantly.

Addressing Geographic Diversity


Motivation Behind Synthetic Data

Synthetic imagery can thus help us diversify our training data, by adding more examples of different, representative satellite images. Diversified training data, such as the "All Cities" example we see in the table above, can help us overcome the geographic differences, and build robust models, agnostic to geography.

Another great thing about synthetic data is that it removes the need for hand-annotation and manual labelling.


Example of Synethetic Images from the Synthinel-1 Dataset


Towards Realistic Textures

However, synthetic imagery is visibly different in its textures and styles from real satellite imagery. We can see from the three synthetic satellite images above, that they do not have enough resemblance to real life buildings - there is something "off" and different about them.

To make them more realistic, we plan on transferring textures from real satellite imagery to synthetic imagery:


Texture Synthesis Automated Pipeline (TSAP)

The reason for switching to buildings is because the INRIA Aerial Image Labeling dataset(link) has high resolution satellite imagery of cities with labeled buildings. If we can build models that identify buildings, they can be expanded to identify other types of infrastructure as well. Source: INRIA Dataset

In order to automate the extraction, synthesis, and substitution of building rooftop textures, we created a pipeline that takes any of the 2500 images of cities in the INRIA dataset, capture the building rooftop texture in each city, then transfer the visual content and style onto a texture patch while maintaining image resolution, and finally, substitute these rooftop textures on top of buildings in simulated environments to create synthetic cities that are geography-agnostic.


Step 1: Rooftop Extraction

  1. First, we go through the satellite image and get only the buildings
  2. Upon isolating each individual building, a bounding box is made containing the rooftop.
  3. The process we made automatically crops a rectangle out of the rooftop (for feeding into synthetic generation).
Figure: How roof-extraction works
Figure: Examples

Texture Synthesis


Once we have obtained the largest rectangular roof patch, we want to be able to transfer the visual content and style of this roof texture to buildings in any other image. Using a picture of red peppers shown above as an example, the model should be able to take a snapshot of the red peppers’ color, shapes, background, and other characteristics and reconstitute them in a new image, shown on the right.


Step 2: Texture Synthesis

In our situation, we accomplished this by applying a feed-forward convolutional neural network model that recreates the color, gradient, rooftop structure, and more in a new texture patch, as seen below with the example of a roof of a building in Austin.

Figure: Our Process: Extracted Image of a Rooftop in Austin is Fed into the Model and Synthesized into the Texture Patch on the Right

Figure: We Sourced 4 Rooftop Textures and Reconstituted Each of Them in 4 Different Texture Patches Shown on the Right.

Step 3: Create Bank of Rooftop Textures

We then apply this model on unique rooftops for all 2500 images of 5 cities in the INRIA dataset, and create a bank of rooftop textures arranged by the city from which they were extracted. This way, we have a bank of textures to draw from when we create synthetic imagery, as seen in the example below with the city of Vienna, Austria.


Expanding to Other Object Image Types

Figure: Next Step - Including Landscapes in Our Synthetic Texture Bank. (1. forests; 2. rivers; 3. carparks; 4. farms)

Using building rooftops as a proof-of-concept in our goal to include more diversity in landscape and infrastructure types in training data, we envision creating a whole scene or a simulated environment with buildings and landscapes such as rolling hills and rivers from our rooftop texture bank. With successes applying our model on forests, rivers, carparks, and farm fields, we are one step closer to truly being geography agnostic and creating a range of scenes simulating actual landscapes in our target regions.

Once we are equipped with the texture bank, we move onto the next step: feeding textures from our synthetic texture bank to the texture substitution algorithm.

Rooftop Substitution


The last part of our pipeline is texture substitution. Now that we have extracted rooftops from source images and generated synthetic textures, we want to substitute these synthesized textures to new target geographies. Figure 8 shows our texture substitution process.
We take a source image, choose a target image, and match rooftop textures based on the sizing of the target rooftops. This can help make our synthetic cities more realistic, which can do a better job of diversifying training data.

Figure: Rooftop Substitution Pipeline


As shown in the figure on the left, the rooftops are flat, solid colors. However, they can provide the basis of realistic, textured synthetic cities. This is the process laid out in the figure on the right.


Figure: Examples of Rooftop Substitutions
Figure: Texture substitution process


At this point, we can supplement our real satellite imagery with textured synthetic imagery, where the rooftops have been replaced. This will allow us to convincingly represent new regions and create more accurate building maps. As this research progresses, the team will expand this pipeline to other types of infrastructure besides buildings, eventually allowing us to map out entire energy grids around the world.

CONCLUSION


Our team focus has been to create a geographic agnostic model to identify energy infrastructure in satellite images. Existing model’s accuracy was decreased significantly due to lack of diversity in training data of satellite images. We need synthetic images to make training datasets more diverse and more representative of a broader range of geographies.

As a proof of concept, we have worked on generating synthetic rooftops in satellite images. We extracted building rooftops from images in the INRIA dataset, synthesized textures characteristic of these rooftops, and substituted them atop buildings in other images, which gave us satellite images with synthetic rooftops of our desired texture.

Our final output consists of a bank of textures of building rooftops from different cities, along with several examples of applying these textures onto simulated urban environments generated by CityEngine (a 3-D modelling software) to generate synthetic images of cities that capture unique features from different geographies.

Texture Samples


Sample roof textures generated from Austin satellite images

Future Steps


  1. Perform semantic segmentation on our 'mixed' dataset with both satellite imagery and realistic synthetic cities, and compare the results.

  2. Share our work with future teams on our Github Repository

  3. Generate database of “synthetic cities” for researchers to make their training data more diverse.

  4. This project can help inform companies and government on accurate estimates of locations with or without existing energy infrastructure. This, in turn, can help them devise strategies on grid expansion and maintenance.
Potential Applications

Meet the Team

Gaurav Uppal

Class of 2020

Mechanical Engineering

Scott Heng

Class of 2021

Computer Science & Statistical Science

Jason Wang

Class of 2021

Computer Science

Aneesh Gupta

Class of 2022

Computer Science and Electrical Engineering

Norah Tan

Class of 2022

Computer Science & Mathematics

Winston Yau

Class of 2022

Public Policy & Physics

Vivek Sahukar

Class of 2020

Masters in Interdisciplinary Data Science

Ayooluwa Balogun

Class of 2021

Mechanical Engineering

Acknowledgements

Project advisors:

Dr. Kyle Bradbury

Dr. Leslie Collins

Dr. Jordan Malof